Qwen 3.6 MoE Routing, Measured: Flat Is the Wrong Number
Every mixture-of-experts cache design being argued about right now rests on a claim about what the router does. Not on kernels or PCIe or anyone’s code, but on a claim about which experts a model actually picks. And the two loudest versions of that claim contradict each other.
One camp says routing is flat: the busiest 10% of experts carry only about 18% of the work, so there’s no hot set, and caching is fighting the model’s own design. The other camp, the RFC behind several of the competing forks, says roughly 10% of experts handle about 80% of tokens — skew so strong that caching is nearly free.
Both cannot be right about the same model. So I stopped reading and traced it.
Six workloads, 2,048 generated tokens each, on Qwen 3.6-35B-A3B running on my RTX 3060 12GB. Every routing decision the model made: 40 layers, eight experts chosen from 256 at every token, 81,920 rows per trace, 3,932,160 expert selections in total. Here’s what the router does.
The flat number is real, and it’s measuring the wrong thing
Start with the claim that says don’t bother, because it’s the one I could reproduce immediately.
Rank every expert in the model by how often it fires, take the busiest 10%, and count their share of the routing. On my code trace that comes out to 17.2%. The published figure for this method is 16.6%. Same ballpark, same conclusion: barely above the 10% you’d get from a coin flip. Flat.
The arithmetic is correct. The problem is what got ranked.
Qwen 3.6-35B-A3B has 40 layers with 256 experts each. That’s 10,240 separate weight tensors, and pooling them into one ranking treats expert #5 in layer 0 as interchangeable with expert #5 in layer 20. They aren’t. They’re different weights, they never substitute for each other, and no cache ever chooses between them — a cache holds slots per layer, so the only question it can ever ask is which experts are hot inside one layer.
Pool 40 concentrated distributions together and you get something that looks flat. That’s not a measurement of the router. It’s an artifact of the pooling.
Here’s the same six traces, measured per layer and then averaged across the 40:
| Workload | Top 10% | Top 25% | Top 50% | Pooled top 10% |
|---|---|---|---|---|
| code | 44.8% | 70.9% | 90.9% | 17.2% |
| chat | 52.5% | 79.2% | 94.9% | 18.6% |
| long-context | 41.7% | 68.9% | 90.5% | 14.6% |
| German technical prose | 54.9% | 80.4% | 95.1% | 18.3% |
| held-out code | 48.3% | 74.5% | 92.5% | 17.8% |
| held-out chat | 54.5% | 81.4% | 95.6% | 17.1% |
| perfectly flat would be | 10.0% | 25.0% | 50.0% |
Inside a layer, the busiest 10% of experts carry 42 to 55% of that layer’s work. Four to five times uniform.
I want to be careful about how I characterise the mistake, because it’s a subtle one and it isn’t sloppiness. The pooled statistic is a perfectly reasonable thing to compute if the question is “does this model use all its capacity.” It’s the wrong statistic only for the specific question a cache asks. Correct arithmetic, wrong quantity. I computed the same number myself before I noticed what it was ranking.
The proof that doesn’t depend on any of that
If you don’t want to take the per-layer table on faith, there’s a check that uses none of it.
Suppose you keep 112 of each layer’s 256 experts resident in VRAM — 43.8% of them. If routing really were flat, you’d catch about 43.8% of the traffic, because you’d be holding a random-ish 43.8% of a uniform distribution.
Measured, that configuration catches 87.6% to 93.0%, depending on workload. You cannot get double your slot fraction out of a flat distribution. The hit rate alone settles it.
So both camps have it wrong, and it’s worth saying which way. Routing isn’t flat — but 10% of experts don’t carry 80% of tokens either. They carry about 48%. The truth sits between the two published claims, and it is skewed enough for caching to work, just not for the reason its proponents give.
How many slots are actually worth having
That’s the part you can act on. If concentration is real, the question becomes how much VRAM to spend chasing it.
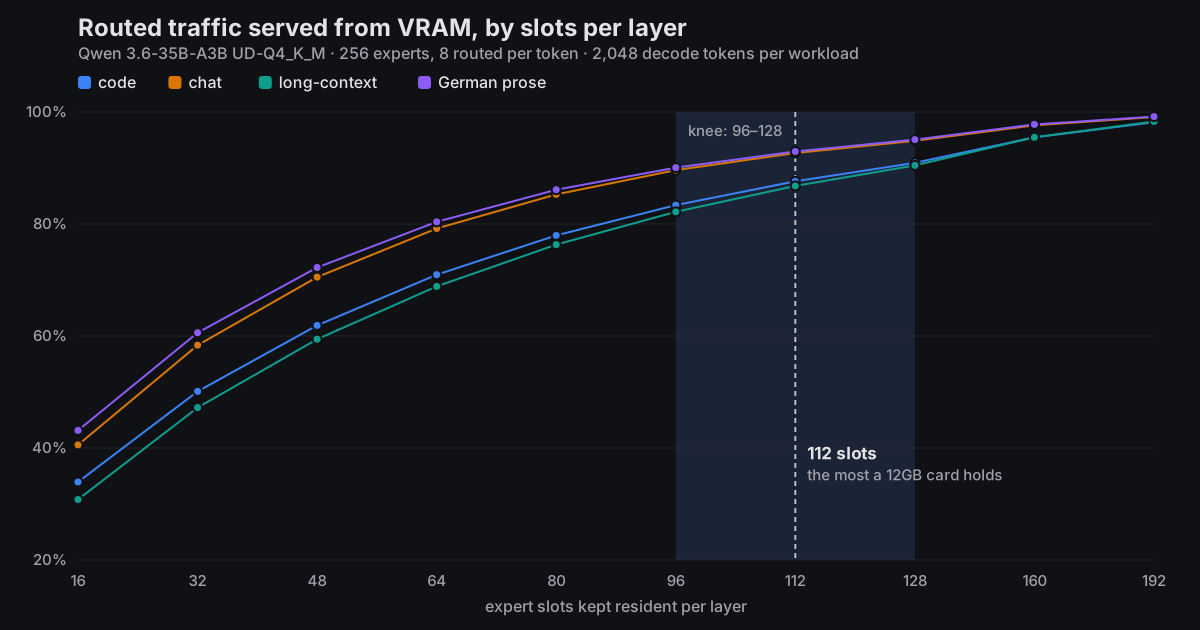
| Slots/layer | VRAM | code | chat | long-ctx | German | Mean | Gain per 8 slots (normalised) |
|---|---|---|---|---|---|---|---|
| 16 | 1.13 GiB | 33.9% | 40.6% | 30.8% | 43.1% | 37.1% | — |
| 32 | 2.27 GiB | 50.1% | 58.4% | 47.2% | 60.6% | 54.1% | 8.48 pp |
| 48 | 3.40 GiB | 61.9% | 70.5% | 59.4% | 72.2% | 66.0% | 5.98 pp |
| 64 | 4.53 GiB | 70.9% | 79.2% | 68.9% | 80.4% | 74.8% | 4.41 pp |
| 80 | 5.66 GiB | 78.0% | 85.3% | 76.3% | 86.1% | 81.4% | 3.29 pp |
| 96 | 6.80 GiB | 83.4% | 89.6% | 82.2% | 90.1% | 86.3% | 2.45 pp |
| 112 | 7.93 GiB | 87.6% | 92.7% | 86.8% | 93.0% | 90.0% | 1.85 pp |
| 128 | 9.06 GiB | 90.9% | 94.9% | 90.5% | 95.1% | 92.8% | 1.41 pp |
| 160 | 11.33 GiB | 95.5% | 97.6% | 95.5% | 97.8% | 96.6% | 0.94 pp |
| 192 | 13.59 GiB | 98.2% | 99.1% | 98.3% | 99.2% | 98.7% | 0.53 pp |
A note on that last column, because it is not a raw difference. The table steps by 16 slots up to 128 and by 32 above it, so no row is an actual 8-slot increment. Each value normalises the gain over the row above onto a common 8-slot basis: (mean − mean above) × 8 ÷ (S − S above). That is what makes the marginal returns comparable across the two step sizes, and it reproduces from the rounded means in the table to within 0.03 pp if you want to check it.
The curve bends between 96 and 128. Past that you’re paying roughly a gigabyte per percentage point, which is a bad trade on any card and an impossible one on a small card.
Now the part I didn’t expect. Work out what a 12GB card can physically hold: 112 slots costs 7.93 GiB, the attention and shared weights that stay resident regardless cost 2.38 GiB, and that totals 10.31 GiB against about 11.63 GiB usable, leaving 1.32 GiB for the KV cache and compute buffers. Step up to 128 slots and you need 11.44 GiB before the KV cache gets a single byte. It doesn’t fit.
So on a 12GB card the diminishing-returns knee and the fit ceiling land on the same number. That’s luck, not design. But it means 112 isn’t a tuning parameter you need to sweep — it’s the only sensible answer, and it happens to be where the curve was flattening anyway. If you own a 3060 and you’re ever offered a slot count to set, that’s the one.
For context on what that would replace: our current recommended config on this card is --n-cpu-moe 24, which keeps 16 of 40 layers’ experts on the GPU and pushes the other 24 layers into system RAM. That serves 40% of routed traffic from VRAM — all of it in 16 layers, none of it in the other 24. At the same memory cost, spreading those bytes as per-layer slots would serve about 88%.
Why the model looks concentrated at any instant and flat over a run
This is the thing that makes caching work at all, and it’s easy to state.
Count how many distinct experts appear in a sliding window of generated tokens:
| Window | Expert activations | Distinct experts | Share of 256 |
|---|---|---|---|
| 10 tokens | 80 | 40.8 | 16.0% |
| 50 tokens | 400 | 97.6 | 38.1% |
| 200 tokens | 1,600 | 156.0 | 60.9% |
Over ten tokens the model touches about a sixth of each layer. Over two hundred it has touched three-fifths. The working set is genuinely narrow moment to moment and genuinely broad over a paragraph, and those two facts aren’t in tension; they’re the definition of temporal locality.
The strangest result, and it holds up
Here’s the claim I most expected to fall over: a cache that knows nothing, using plain least-recently-used eviction, beats a cache with perfect knowledge of the entire run.
It holds. At 64 slots per layer:
| Workload | Static oracle | LRU | Prefill-only profile |
|---|---|---|---|
| code | 70.9% | 76.4% | 59.2% |
| chat | 79.2% | 81.5% | 70.1% |
| long-context | 68.9% | 74.8% | 57.7% |
| German prose | 80.4% | 80.3% | 66.6% |
LRU wins in three of four workloads, by up to six points, against a policy that was allowed to read the whole future and pick the 64 most-used experts in advance.
The fourth is a tie rather than a loss: German prose at 80.3% against 80.4%, which is a wash. It’s also the workload with the most concentrated routing to begin with, at 54.9% of each layer’s work in its top tenth, the highest figure in the table further up. That ordering holds across all four rows. The more concentrated the routing, the less LRU gains: +6.0 points on the flattest workload, +5.5, +2.3, then −0.1 on the sharpest. Where the hot set is already stable, a fixed profile has the least to lose. Four workloads is a pattern rather than a law, but it is the pattern the mechanism predicts.
There’s no paradox once you name what the oracle actually knows. It has perfect information about long-run frequency and it is static — it picks a set and holds it forever. LRU knows nothing about frequency and adapts to recency. The sliding-window table above is why that wins: at any given moment the model is working in a narrow slice, and which slice it is keeps moving. Perfect information about the wrong statistic loses to no information about the right one.
Note the third column too. A profile built only from the prompt, before any tokens are generated, lands 10 to 12 points below the oracle. That’s the cheapest possible profile and it’s meaningfully worse than the alternatives.
The part where LRU probably loses anyway
Hit rate is not the whole cost function, and this is where my rig has something to say that the simulators don’t.
Every LRU hit is free, but every miss is an upload. Running their simulator on my traces, at 112 slots LRU buys +1.8 points of hit rate for 64.74 MB of PCIe traffic per token. (That upload figure is their simulator’s output, not my own instrumentation — I’m quoting their tool here, while the hit rates above come from an analyser I wrote separately.) Static top-S, by contrast, uploads nothing at all in steady state: the slots are filled once at load and never move.
Put that 64.74 MB against a real link. My 3060 sits in a PCIe 3.0 board, and I measured its pinned host-to-device rate directly at about 8.3 GB/s — derived by forcing expert weights across the bus at batch size 1 and dividing the known per-token expert bytes by the resulting token rate. At that speed, 64.74 MB costs roughly 7.8 ms per token, against a token budget of about 25.7 ms at the 38.9 tok/s this card actually does.
Nearly a third of the token budget, to buy 1.8 points of hit rate. On this class of machine that trade is very likely a loss.
Worth knowing if you go reading the simulator output yourself: it hardcodes system RAM at 45 GB/s and PCIe at 12.4 GB/s. This box runs DDR4-2133 at about 34 GB/s, and I measured 6.5 to 8.3 GB/s over its PCIe 3.0 link depending on whether the memory is page-locked. Its cost columns are optimistic for a budget rig by roughly half on the link, which is exactly the direction that flatters an upload-heavy policy.
Profiles transfer better than advertised
If a cache needs a routing profile, the obvious worry is that you’d need a different one per task. Measured, the top-112 sets overlap far more than I expected:
| code | chat | long-ctx | German | |
|---|---|---|---|---|
| code | — | 66.6% | 71.0% | 67.5% |
| chat | 66.6% | — | 74.8% | 81.9% |
| long-context | 71.0% | 74.8% | — | 72.5% |
| German prose | 67.5% | 81.9% | 72.5% | — |
Between 66.6% and 81.9% shared, against a published figure of roughly 40% for this comparison. German technical prose shares 82% of its hot set with English chat, which is the pair I’d have bet against.
Using the wrong profile does cost something: a code-built profile scores 70.3% on chat against chat’s own 92.7%. But a profile merged from all four workloads lands within 4 to 8 points of every purpose-built one and never collapses. If you ever build one of these, build it from a mixture and stop worrying about it.
Early layers are the ones nobody’s provisioning for
The last result is the one I think is genuinely unexploited.
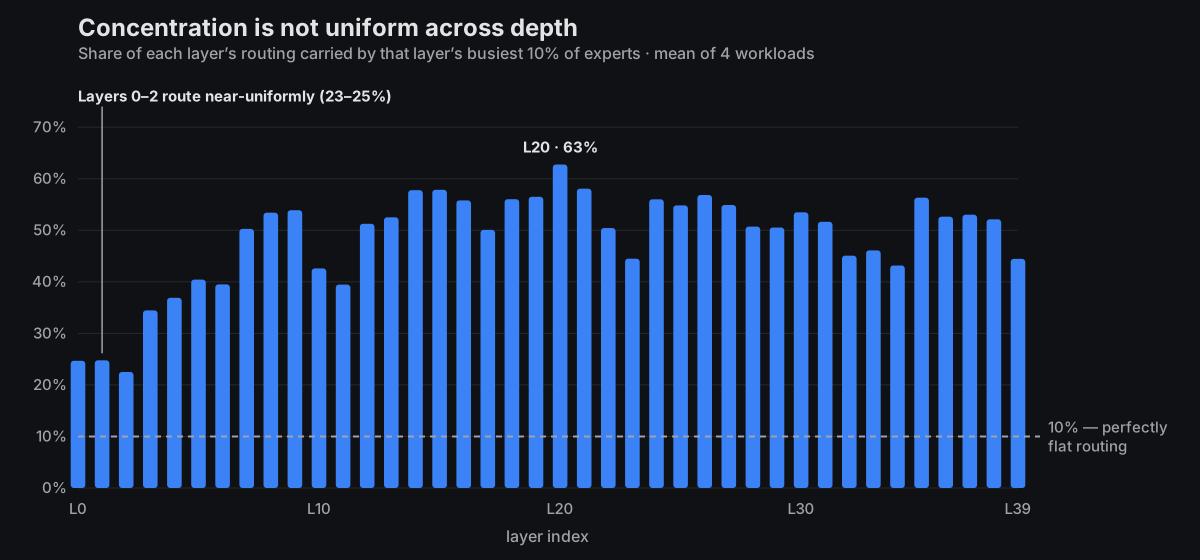
Concentration is not constant with depth. Layers 0 through 2 sit at 22.5–24.8%, climb through the thirties and forties, and peak at 62.8% at layer 20 before easing back to the mid-forties by layer 39. The consequence shows up directly in hit rate: at 112 slots, the first thirteen layers manage 78.7–85.9% while the middle band reaches 91.1–96.5%.
A uniform slot count over-provisions the middle of the network and under-serves the front. Nothing I’ve looked at allocates slots by depth. There’s real headroom there, and it costs no extra VRAM — only a smarter split of the VRAM you were already spending.
What this does not tell you
Hit rate is not speed. Everything above is routing structure, measured offline from traces. I have not shown that a 90% hit rate produces a single extra token per second, and you should not read it that way. Whether hits become throughput depends on the miss path, on kernel efficiency, and on exactly the upload traffic the section above is worried about. Those are separate measurements and I haven’t made them.
I measured the model, not anyone’s implementation. Nothing here says any particular expert cache works or doesn’t work. The traces describe Qwen 3.6-35B-A3B’s router. What any given piece of code does with that structure is a different question.
I deliberately took no timings. The branch carrying the tracer also carries a KV-cache quantisation scheme, a new quant type and a fused attention decode path that is on by default. Any tok/s number off that build would be confounded by three things at once, so I didn’t collect any.
Two thousand tokens per trace is the floor, not the default. The tracer ships with a 512-token default. Building a profile from the first 512 tokens of my code trace and scoring it against the full run gives 84.4%, against 87.6% from the full 2,048. The default is directionally right and not a number I’d quote.
Method
The tracer is in-tree on the fork that carries this work and it only observes: it hooks params.cb_eval, the same evaluation callback llama-imatrix uses, then reads the ffn_moe_topk id tensors off the scheduler. It alters neither routing nor generation. I ran it with the expert cache switched off, on an otherwise stock path. Routing is independent of where the weights physically live, since the router reads hidden states and not memory addresses, so tracing at --n-cpu-moe 24 doesn’t bias the result.
Model was unsloth’s Qwen3.6-35B-A3B UD-Q4_K_M, sha256-verified against the upstream digest before the first trace and again after the last, both matching. llama.cpp build b10088. RTX 3060 12GB, i7-7700, 32GB DDR4-2133, PCIe 3.0 x16, headless, four threads pinned explicitly.
Four workloads went into the analysis — real code with a review task, a hardware-advice conversation, a long-context summarisation of a real incident report, and German technical prose. Two more were fixed as a held-out set before any analysis ran and were never used to build a profile, which is the only way a later cache test avoids grading its own homework. Every trace was checked for degenerate repetition; repeated expert-tuple rates ran 0.0–0.3%, so none of the concentration above is a model looping.
The hit rates come from an analyser I wrote from scratch. I then ran the fork’s own simulator over the same traces as a cross-check: the two agree to within 0.1 points on static-oracle, static-prefill and LRU, and diverge 2 to 5 points on LFU-with-decay where the insertion rules differ. The policies that carry the argument are the ones that match exactly.
The bottom line
Routing in Qwen 3.6-35B-A3B is concentrated, and the “flat” number that says otherwise is measuring across layers when the only thing that matters is inside them. The top tenth of each layer’s experts does roughly half that layer’s work, the instantaneous working set is about a sixth of a layer, and 43.8% of the experts will catch about 90% of the traffic.
If you’re on a 12GB card, 112 slots per layer is the number, and pleasingly you don’t have to think about it — it’s simultaneously where the returns flatten and the most the card will hold. If you’re evaluating one of these caches, judge it on upload traffic and not just hit rate, because on a PCIe 3.0 box the policy with the best hit rate is the one most likely to lose. And if you’re building one, allocate slots by depth. The front of the network is where the current designs leave value sitting.
None of which is a speed claim. It’s a map of what the router does, which is the thing everyone has been arguing about without measuring.
Related guides
- Best Way to Run Qwen 3.6 35B MoE Locally — the throughput side of this model, including the
--n-cpu-moesweep on this same 3060 - MoE Models Explained — what routing is and why sparse models behave the way they do
- Every SSD-Streaming MoE Engine — the other approach to experts that don’t fit, and its licensing mess
- Qwen 3.6 Complete Guide — the dense 27B against this 35B-A3B, and which to pick
A weekly email with every new guide and measured benchmark.
Subscribe — free, no spam