LLM on a Microcontroller: ESP32-S3 at 22.6 tok/s
📚 More on this topic: Does RAM Speed Matter for Local LLMs? · Strata vs llama.cpp on an RTX 3090 · Why Your Local LLM Is Slow · Quantization Explained · InsiderLLM Benchmarks
A Better Stack video got a lot of people flashing a 28.9-million-parameter language model onto “a chip that costs about $8” and watching it write children’s stories at “nine tokens a second.” The project behind it is esp32-ai by slvDev (Viacheslav Sierbov). It runs a TinyStories model on an ESP32-S3 with no OS and no network.
I reproduced it on my own board first. Then I pre-registered each change before timing it: what I expected, in writing, with a hash. The whole thing ended at 22.59 tok/s, against 10.34 for the same firmware with the display code off, and the output never changed: the same 200 tokens of text byte for byte, and the same logits for the first 20 tokens, by hash. Three of my 25 predictions on the board were wrong. Those three were the useful ones.
The box: ESP32-S3 N16R8 (rev 0.2, 16 MB flash, 8 MB octal PSRAM), Arduino-ESP32 core 3.3.10, esp32-ai at commit 52ebcbb, the release TinyStories model, CPU at 240 MHz, no display attached.
The short version
| build (240 MHz, n = 3 resets each) | head ms | non-head ms | ms/token | tok/s | output hash |
|---|---|---|---|---|---|
| scalar, display code off (my baseline) | 59.1 | 35.5 | 94.7 | 10.34 | 4400a1cbf4a5137d¹ |
| + SIMD int8 head | 43.6 | 35.5 | 79.1 | 12.31 | 4400a1cbf4a5137d |
| + int4 head | 24.1 | 35.5 | 59.6 | 16.21 | 4400a1cbf4a5137d |
| + SIMD core | 24.1 | 26.4 | 50.4 | 19.05 | 4400a1cbf4a5137d |
| + logits in SRAM² | 21.2 | 26.3 | 47.5 | 20.62 | 4400a1cbf4a5137d |
| + int4 core | 21.2 | 22.0 | 43.3 | 22.59 | 4400a1cbf4a5137d |
| upstream’s figures, as published (theirs) | 59.4 | 35.6³ | 94.9 | 9.88⁴ | not published |
¹ The baseline hash comes from a gate build of the scalar head. The timed scalar runs had the checksum compiled out; their 200-token text is byte-identical to every row below. ² Exploratory, n = 3, gated exact. The pre-registered version of this step also moved the head’s scales to fp16 and came out slower (section 8). This row also carries the end-of-story flag, switched off, which changes nothing (section 10). ³ The sum of upstream’s published stage times: input 2.2, attention 20.5, FFN 6.5, PLE 6.4. ⁴ Labelled “attached serial” in upstream’s firmware README, and “(9.88 tok/s attached)” in its RESULTS.md.
The output hash is a 64-bit FNV-1a over the raw logits of the first 20 generated tokens, checked alongside a byte comparison of all 200 tokens of text. Same hash and same text means identical logits for the first 20 tokens and identical text for all 200.
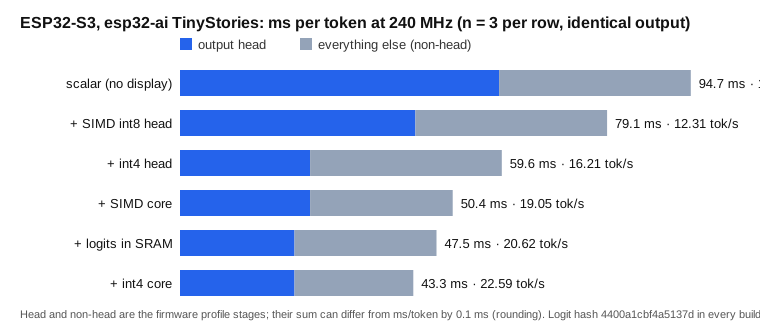
Against my baseline that’s 94.7 to 43.3 ms per token, 2.19x. In tok/s, which also counts the time spent picking and printing each token, 10.34 to 22.59 is 2.18x.
1. How esp32-ai fits a 29M model on a microcontroller
The trick is placing each part of the model by how often it gets read. slvDev spells this out in the sketch’s own header comment.
| where | what lives there | how often it’s read |
|---|---|---|
| flash (16 MB, memory-mapped) | the 25.2M-parameter per-layer embedding (PLE) table and the token embedding, 4-bit | one row per token |
| PSRAM (8 MB, octal) | the core weights staged to int8, the output head, the fp32 KV cache | every token |
| internal SRAM (512 KB) | scratch buffers and the norm vectors | many times per token |
The PLE table is most of the model, 25,165,824 of the 28.9M parameters: 32,768 rows of 768, one per input token, and each token pulls only its own row out of flash. Everything that computes sits in PSRAM, where the shipped firmware allocates 4.19 MB at boot. SRAM holds a managed hot set of 29,320 bytes.
The output head is a tied copy of the first 25,353 rows of the token embedding, 96 columns wide, 2.43 MB as int8. It gets read in full every token, and it’s the biggest thing in PSRAM. Remember that one.
2. Reproducing it first
Before changing anything I flashed upstream unmodified (scripts/deploy.sh tinystories) and read the profile. This
run was confirmatory, not blind: I knew upstream’s numbers, and every prediction after it was written with this
profile in hand.
| per-token stage (n = 1) | upstream (their RESULTS.md) | my board |
|---|---|---|
| ms/token | 94.9 | 95.0 |
| head | 59.4 | 59.4 |
| attention | 20.5 | 20.5 |
| FFN | 6.5 | 6.4 |
| PLE | 6.4 | 6.4 |
| input | 2.2 | 2.2 |
That’s a reproduction to 0.1 ms. My tok/s came out at 5.43 against their 9.88, and that gap isn’t real. The shipped
sketch hard-codes #define USE_DISPLAY 1 and talks to an OLED over I2C every token. I had no display attached, so the
run logged 1,965 I2C errors, and those eat wall time. ms/token times only the forward pass, which is why it still
matches. With the display code turned off the same firmware does 10.34 tok/s. That’s my baseline.
I also retrained the model from upstream’s recipe on my RTX 3090 bench box, seeds 0 and
- Validation perplexity came out 11.37 and 11.39, a mean of 11.38 against upstream’s two-seed 11.41, and both exports pass upstream’s own C-against-PyTorch check with a max abs difference of 0.00001.
One number didn’t match at first. The training script reports 558,368 core parameters; the release metadata says 556,416. I built the model on CPU and counted. The 1,952 difference is exactly the 20 RMSNorm weight vectors (6 × 3 × 96 + 96 + 128): the training script counts them, the release metadata counts matrix weights only. Same model.
Neither retrain was flashed. Every number on the board below is the release model.
3. Three things the video got slightly wrong (and one it asked about)
The video is a good introduction, and it got people building. Three details are off.
“So, the 25 million row table lives in flash memory” (00:02:05). It’s 25 million parameters, 25,165,824 in the release metadata. The table has 32,768 rows, one per input token, each 768 values wide (6 layers × 128).
“the ESP32-S3 is a chip that gives you 512 KB of SRAM. And that is the amount of fast memory this chip can compute with” (00:00:44). That’s the internal SRAM figure, but the model doesn’t run inside it. The video also says “the attention head and feed forward stays in SRAM” (00:01:55). Those weights sit in the 8 MB of PSRAM. SRAM holds about 29 KB of activations and norm vectors.
llama2.c as “the blueprint this entire project is built on” (00:03:20). Upstream’s RESULTS.md says no code, model or method derives from Karpathy’s llama2.c, and that it appears there only as comparison context. To be fair, upstream’s README does call llama2.c “the reference for training a small language model and running it in plain C.” A reference, then. Not the blueprint.
Then there’s the little girl. The best moment in the video is the model drifting back to “that one specific story about that little girl,” over and over, and Andres says “I have no idea why this is happening” (00:06:15). I think I can answer that one.
The firmware never stops. The end-of-story token, <|endoftext|> (id 0), decodes to an empty string, and the only
stop condition in the loop is 200 tokens. So the board crosses each story boundary without printing anything and
starts a new story. New stories in the training data mostly start one way: of the 344,375 stories in the slice the
model was trained on, 12.60% open with exactly “Once upon a time, there was a little girl named”. Lily is the top
name after “named”, in 12.63% of all stories, 2.6x the next one (Timmy).
The model overdoes it, though. I ran 50 fixed prompts through my two retrained checkpoints, in PyTorch on the 3090, not on the board. Greedy decoding restarted in 76% of generations, and 100% of those restarts opened with Lily or “little girl”. Sampling at T 0.8 / top-p 0.9 only brought that down to 50–56%. On the same test (Lily or “little girl” in a story’s first 60 tokens) the training data scores 34%.
So it’s a prior from the training data, amplified 1.5–3x by decoding that always takes the most likely token. Section 10 adds a flag that stops the board at the boundary instead.
4. The clock sweep that pointed the wrong way
The first real experiment changed only the CPU clock: 240, 160 and 80 MHz, 3 runs each. Upstream’s RESULTS.md says the head runs into a PSRAM bandwidth floor, and I wanted to check that. If the head is waiting on memory, slowing the CPU shouldn’t slow it much.
I pre-registered three predictions. All three failed.
| prediction (pre-registered) | measured |
|---|---|
| non-head stages scale within ±15% of 1/f: ~107 ms at 80 MHz | 86.7 ms (band 90.8–122.8) |
| head changes by less than 30% of the CPU-proportional change | 72% at 160 MHz, 77% at 80 MHz |
| total at 160 MHz falls in 110–125 ms | 128.3 ms |
My prediction was wrong. The head slowed almost in step with the clock: 59.1 ms at 240, 80.3 at 160, 149.9 at 80.
Then I made it worse. I fitted each stage to t = a/f + b, a clock-scaled part plus a fixed part, and the fit gave the head only 13.7 ms of clock-independent time. I read that as “the head is not bandwidth-bound”, against upstream’s ~40 ms floor. That was wrong too, and the next experiment showed it.
5. SIMD exposes the real floor
The ESP32-S3 has a SIMD unit, which Espressif calls PIE, with an int8 vector multiply-accumulate, ee.vmulas.s8.accx.
I moved the head’s int8 matrix-vector product from a scalar loop to a hand-written kernel on it. The integer sums are
exact, a boot self-test checks all 25,353 rows, and the gate (hash over the first 20 tokens, text over all 200)
didn’t move.
At 240 MHz the head went from 59.1 to 43.6 ms. Then it stopped caring about the clock: 44.7 ms at 160, 48.3 at 80. The fit now says b = 41.3 ms of fixed time and only 2.4 ms that scales with the clock at 240.
The head reads 2,535,300 bytes per token, 2,433,888 of weights and 101,412 of scales. Over 41.3 ms that’s about 61 MB/s, or about 64 counting the logits it writes back. Upstream measured 60.7 MB/s in its own PSRAM read benchmark. The floor had been there all along.
So why did section 4’s fit miss it? The scalar head’s arithmetic, about 45 ms of it at 240 MHz, was overlapping the memory traffic and hiding it. An additive model can’t see overlap. It books the overlapped time as clock-scaled, because the compute is the part that shows. Take the compute away and the floor is sitting right there.
6. Halving the bytes: the int4 head
If the head is paying for bytes, send fewer bytes. The model file already stores the head as 4-bit codes; the firmware unpacked them to int8 at boot for speed. I restaged the head as packed int4 and unpacked it inside the SIMD kernel instead: 1,216,944 bytes of weights in place of 2,433,888. Still exact, still 25,353 of 25,353 rows on the self-test.
| head (240 MHz, n = 3) | bytes read per token | head ms | clock-independent (b) | clock-scaled at 240 |
|---|---|---|---|---|
| int8 SIMD | 2,535,300 | 43.6 | 41.3 | 2.4 |
| int4 SIMD | 1,318,356 | 24.1 | 22.6 | 1.6 |
Half the bytes, half the floor: total head traffic over b works out to about 63 MB/s in both rows. The unpack didn’t cost anything I could see either. Clock-scaled time went down, 2.4 to 1.6 ms, where the prediction would have called the head partly compute-bound again past 8. Free PSRAM went from 3.77 MB to 4.93 MB as a bonus.
7. The rest of the model: SIMD core, same masking effect
With the head at 24.1 ms, the other 35.5 ms became the bigger share. Every integer matrix-vector product in the core (eight kinds of matrix) moved to PIE kernels. The down projection has 66 columns, so I zero-padded it to 80 to keep its rows 16-byte aligned. All the float work (attention scores, softmax, norms, RoPE, activations) stayed exactly as it was.
Non-head went from 35.5 to 26.4 ms at 240 MHz with the same hash and text, and the head unchanged at 24.1. Total 50.4 ms, 19.05 tok/s.
The fit shows the same masking again. The clock-scaled part of non-head fell 14.2 ms (25.60 to 11.45), but the time only fell 9.1, because the fixed part rose 5.0 ms (9.90 to 14.95). With the arithmetic out of the way, the 556 KB per token of core weights started to show through, exactly the way the head’s bytes had.
8. Small exact wins around the head
Two things still touched PSRAM around the int4 head: its fp32 scales (101,412 bytes per token, stored as fp16 in the file) and the 101,412-byte logits buffer it writes.
The pre-registered change did both: keep the scales fp16 and put the logits in internal SRAM. The head went from 24.1 to 21.7 ms at 240 MHz (n = 3), inside the predicted 21.0–23.5, with non-head flat at 26.3. A boot self-test checks that every fp16 scale widens to the same fp32 value as before, and the hash didn’t move. The logits fit in SRAM with room to spare: free internal SRAM went from 309,056 to 206,652 bytes, and the largest free block from 262,132 to 163,828.
Afterwards I split the two apart. These runs are exploratory.
| head-traffic config (240 MHz) | n | head ms | ms/token | tok/s |
|---|---|---|---|---|
| neither (control) | 3 | 24.1 | 50.4 | 19.06 |
| fp16 scales only | 1 | 23.9 | 50.3 | 19.10 |
| logits in SRAM only | 3 | 21.2 | 47.5 | 20.62 |
| both (the pre-registered build) | 3 | 21.7 | 48.0 | 20.40 |
The SRAM move carries the whole gain. fp16 scales save 0.2 ms on their own with the logits in PSRAM, and cost 0.5 ms once the logits are in SRAM. My reading, untested: with the logits writes off PSRAM the head stalls less on memory, so the few integer ops per row that widen each fp16 scale stop hiding under the stalls.
The final build uses logits in SRAM only. It passed its own hash gate: 4400a1cbf4a5137d, identical text.
9. int4 core
Same idea for the core. All 43 core tensors, 286,848 bytes, restaged as int4 in the head’s kernel layout. The 96-column tensors use the int4 head kernel as it is. The one 128-column shape gets a new kernel, which has no free vector register, so it swaps the last 32 activation bytes in and out inside its own multiply-accumulate instructions. Down stays zero-padded, now to 96 columns, so its 48-byte int4 rows stay 16-byte aligned. Every row of every tensor is self-tested against the file’s codes.
| non-head (n = 3 each) | 240 MHz | 160 MHz | 80 MHz |
|---|---|---|---|
| control, int8 core at 240 | 26.3 | – | – |
| int4 core | 22.0 | 27.5 | 45.0 |
| ms/token, int4 core | 43.3 | 49.5 | 69.5 |
I predicted non-head would land between 22.0 and 25.0 ms. It came in at 22.0, right on the bottom edge. That figure is the sum of four stages printed to 0.1 ms, so it’s 22.0 ± 0.2, and ms/token minus head gives 22.1. I’m calling it held, at the edge, and I’d rather you knew that than not.
The fit says why it worked. The fixed part of non-head fell from 14.95 to 10.50 ms while the clock-scaled part didn’t move (11.45 to 11.50). The int4 core reads 277,632 fewer bytes per token, and over 4.45 ms that’s about 62 MB/s. Same floor as the head.
10. Stopping at the end of the story
This is the fix for section 3’s loop. I applied the end-of-story patch from my audit of the code: the vocabulary
generator now writes out the end-of-story token’s id, and a compile-time flag, STOP_AT_EOT, breaks out of the loop
when the model picks it.
| setting (240 MHz, one run each) | tokens | text | output hash |
|---|---|---|---|
STOP_AT_EOT=0 (default) | 200 | 763 bytes, identical to every build above | 4400a1cbf4a5137d |
STOP_AT_EOT=1 | 132 | 499 bytes: exactly the first 499 bytes of the uncut text | 4400a1cbf4a5137d (first 20 tokens) |
On the fixed prompt the model picks the end token at step 132, and the flag stops right there. The cut text ends
...You are a good friend."; the uncut text carries on with Once upon a time, there was a little girl.... With the
flag off, the output is byte-identical to before, so every benchmark build keeps it off. Don’t compare the cut run’s
ms/token with the others: 132 tokens means attention averages over a shorter KV cache.
11. Where the 43.3 ms goes now
| stage (int4 core, 240 MHz, n = 3) | ms/token | what it is |
|---|---|---|
| head | 21.2 | 1.32 MB of PSRAM reads per token, at the floor |
| attention | 16.1 | about 8.35 ms clock-scaled float compute, 7.75 ms fixed, mostly fp32 KV-cache reads |
| FFN + PLE + input | 5.9 | 2.4 + 2.5 + 1.0, mostly weight traffic |
The stages add up to 43.2 against the 43.3 printed; that’s rounding. The head’s fit gives 19.6 ms of fixed time in this build. Attention is the next biggest piece. About half of it is fixed time, mostly reading the fp32 KV cache: roughly 484 KB per token, averaged over a 200-token run. The other half is float compute that scales with the clock.
The levers left all cost something. Smaller KV entries (fp16 or int8) would cut those bytes, but they change the output, so they need their own quality gate. A faster PSRAM clock (120 MHz) or a 64-byte cache line means rebuilding Espressif’s precompiled libraries, and 120 MHz octal PSRAM is marked experimental and temperature-sensitive.
What I’d do (should you do this?)
If you have an ESP32-S3 board, check that it’s an N16R8, 16 MB of flash and 8 MB of octal PSRAM. The model needs the
flash and the firmware needs the PSRAM in octal mode. Flash upstream with its deploy.sh and expect about 95 ms per
token; that’s what upstream and I both measured. If you don’t have the OLED, set USE_DISPLAY to 0 in the sketch
first. With no display on the bus, the display code dragged my board from 10.34 tok/s to 5.43.
The five speed patches take the same board to 43.3 ms per token and 22.59 tok/s, with the same 200-token text as the stock firmware and the same logit hash over the first 20 tokens.
The patches are public in my fork, msb-msb/esp32-ai. The default branch,
insiderllm, has all of them, with one branch per change, and a tools branch adds chat.py and the checksum build.
Built from a fresh clone of the fork, the insiderllm branch measured 43.2 ms/token and 22.61 tok/s (n = 3), with the
same 200-token text. I’ve offered them upstream in
esp32-ai issue #26, and upstream remains the canonical project. The
issue’s title figure (1.84x) is from partway through this series; the full stack measures 2.19x. If you only take
part of it, take the head work. The SIMD head and the
int4 head together saved 35.1 of the 51.4 ms per token, 94.7 down to 59.6.
Skip all of it if you want a model that answers questions. This one writes children’s stories, and it is very good at Lily.
Limits
- Speed only. Every build gives the same 200-token text and the same logit hash over the first 20 tokens, and the integer kernels are exact by construction, so quality is unchanged. Nothing here measures quality.
- One board, one model, two days (2026-10-10 and 2026-10-11), one prompt (“Once upon a time”), 200 greedy tokens.
- No power figures yet.
- TinyStories only writes children’s stories.
- One software stack: Arduino-ESP32 core 3.3.10 (IDF v5.5.4),
-O3. A different core version could move the baseline.
Method
Every timed change was written down before it ran: the predictions, their ranges, and what would count as failure.
Each file is hashed, and each was unchanged after its runs. They live in the project repo
(~/Desktop/esp32-llm/evals/<id>/PREREG.md), not on this site. For the four board experiments on 2026-10-10 the
gap between writing the file and the first hardware run was 1.5 to 2.7 minutes; for the host-side decoding test it
was about 1 minute 11 seconds, derived from its log. For the three 2026-10-11 experiments it was 18 to
21 seconds, but their predictions were fixed earlier, at 09:05 that day, in the written brief for the session, and
the files are verbatim copies of its prediction text. The reproduction run is the only one that wasn’t
pre-registered, and it’s labelled confirmatory.
Before any timing, each speed change went through a gate build with a logits checksum compiled in: a 64-bit FNV-1a
over the raw logits of the first 20 generated tokens (4400a1cbf4a5137d every time), plus a byte-for-byte comparison
of the 200-token text. Timing builds have the checksum compiled out. Each configuration got 3 resets, and every
configuration’s three runs printed identical values at the firmware’s 0.1 ms precision.
The fit is t = a/f + b on the 240 and 80 MHz runs, checked against 160. It separates clock-scaled time from fixed time, but only if the two add up. When compute overlaps memory traffic, the fit books the overlap as compute, which is how it hid the head’s floor in section 4. It only became useful once most of the compute was gone.
Counting from the records’ verdict tables: 24 predictions held and 5 failed. The 5 are the clock sweep’s three and two of the four in the host-side decoding test from section 3. On the board alone, 22 held and 3 failed.
Records and credit
The raw logs, patch hashes and build details are in the public records:
- board check
- reproduction
- training rerun
- decoding and the story boundary
- clock sweep
- SIMD head
- int4 head
- SIMD core
- head side traffic
- int4 core
- end-of-story flag
The work is slvDev’s: esp32-ai, the model and the firmware, with the model card on Hugging Face. The video that put it in front of people is Andres’s, at Better Stack.
Next: power per token, once there’s a meter on the board; an interactive demo; and the same model on an ESP32-P4.
A weekly email with every new guide and measured benchmark.
Subscribe — free, no spam