The $36 RAM Fix That Made CPU Inference 56% Faster
📚 More on this topic: Best Mini PCs for Local AI · CPU-Only LLMs · Why Your Local LLM Is Slow · Best Models Under 3B
I have a Lenovo ThinkCentre M710q on the shelf running CPU inference as part of a little swarm. i7-6700T, four cores, 35 watts, the kind of machine offices throw out by the pallet. It came with one 8GB SODIMM in a board that takes two.
That empty slot bothered me for a while. So I measured the box, bought one stick, and measured it again.
Token generation went up 56%. Prompt processing went up under 2%.
I wrote the prediction down first
This is the part that makes the rest of it worth reading.
Three days before the RAM arrived, I benchmarked the machine in its single-channel state and wrote this in the results file:
Prediction for the dual-channel stick: tg should improve substantially (the bandwidth ceiling is demonstrably the binding constraint), while pp should barely move (it is clock-bound and scales with cores, both unchanged). If dual-channel does not lift tg, the bandwidth explanation is wrong and the residual is something else — that is a clean falsifiable test.
Both halves held. Generation up 52-58%, prompt processing flat.
Anybody can run a benchmark after the fact and narrate why the number came out the way it did. Writing down what should happen first, including the thing that would prove you wrong, and then going and finding out. That’s worth something. I got lucky on this one. I’ve been wrong before with this same setup and the file says so, which is the only reason I trust it when it says I was right.
One variable
The reason I trust these numbers is that almost nothing changed between the two runs.
| Before | After | |
|---|---|---|
| RAM | 8GB, one stick, ChannelB empty | 16GB, two sticks, both channels |
| Configured speed | DDR4-2400 clocked to 2133 | DDR4-2400 clocked to 2133 |
| CPU | i7-6700T, 4C/8T | same |
| llama.cpp build | 3653e6d6d (b10326) | same |
| Model files | four GGUFs, Q4_K_M | same files, unchanged |
| Flags | -p 512 -n 128, -r 3 at four threads and -r 2 for the thread sweep | same |
| Bench script | luvia_bench.sh | same file, run unmodified |
| Background load | daemon idle, powersave governor | same |
One thing worth being explicit about: the largest of these four models tops out around 2.6 GB resident, so both runs fit inside the original 8GB with room to spare and neither one touched swap. The jump from 8GB to 16GB isn’t doing any work in these results. What changed is the channel count.
Same box, same script file, same llama.cpp binary, same model files on disk. I ran the identical script rather than writing a new one, which removes a whole category of accidental differences.
Both sticks run at 2133 rather than their rated 2400, and that is expected on this machine. Lenovo’s own spec sheet lists the i7-6700T at DDR4-2133 and notes the system clocks down for processors with a lower memory controller. Not a fault, just the ceiling.
The results
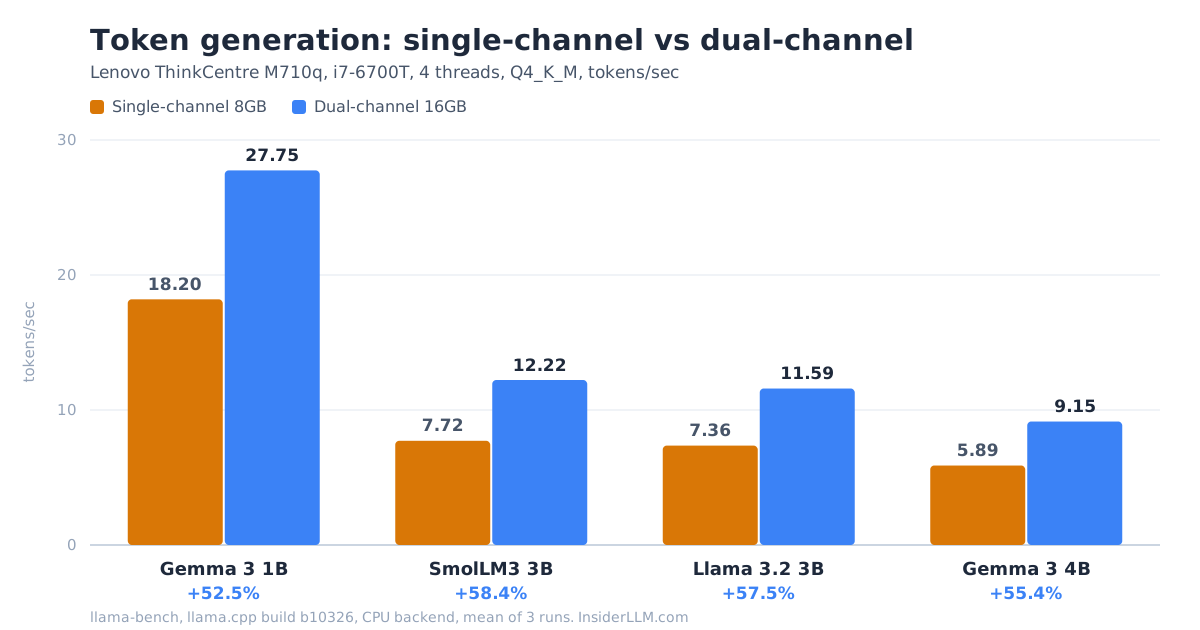
Token generation, four threads, tokens per second:
| Model (Q4_K_M) | Single-channel | Dual-channel | Change |
|---|---|---|---|
| Gemma 3 1B | 18.20 | 27.75 | +52.5% |
| SmolLM3 3B | 7.72 | 12.22 | +58.4% |
| Llama 3.2 3B | 7.36 | 11.59 | +57.5% |
| Gemma 3 4B | 5.89 | 9.15 | +55.4% |
Mean gain 55.9%, spread across the four models of under six points, so no single model is carrying that average. Run-to-run variation was under 0.5% on every one of those figures, so the effect is not noise.
One thing to hold onto about that 56%: it’s a percentage of a half-width baseline. The starting point was a memory bus running at half the width the board provides, which is the exact condition being fixed. A big percentage off a deliberately hobbled starting point is not the same as a big percentage off a healthy one. Nothing here says a machine already running dual-channel has 56% waiting for it.
Gemma 3 4B is the one I care about practically. It went from unusable to merely slow.
Prompt processing didn’t move
| Model | Single-channel | Dual-channel |
|---|---|---|
| Gemma 3 1B | 111.89 | 112.33 |
| SmolLM3 3B | 43.90 | 44.67 |
| Llama 3.2 3B | 44.49 | 44.97 |
| Gemma 3 4B | 38.69 | 39.27 |
Those look like small gains, and two of them are real. Gemma 3 1B moved 0.39%, which against the run-to-run spread on that measurement is 0.2σ — indistinguishable from nothing. Llama 3.2 3B moved 1.08% at 1.9σ, still inside the noise. But SmolLM3 3B moved 1.76% at 5.7σ, and Gemma 3 4B 1.49% at 4.4σ. Those two are resolvable. Small is not the same as absent, and I’d rather say which is which.
So the honest reading isn’t “zero.” It’s that prompt processing moved at most 1.8% — more than thirty times smaller than the 56% on generation — and on the noisiest of the four it vanishes into the spread entirely. That’s a stronger claim than a flat zero, because you can check it.
That is roughly what you would expect, and the standard explanation is arithmetic intensity. Prompt processing is a matrix-matrix multiply across a 512-token batch, so every weight that gets pulled off the bus does work for many tokens before it’s finished with. The cost of fetching it is spread across all of them. Generation is a matrix-vector multiply. It pulls the whole model across the bus and gets one token out of it, then turns around and pulls the whole model again for the next one. Same weights, same bus. One of them amortizes the trip and the other pays full freight every token.
That explanation is textbook and it fits every number above, but I want to be clear about what I actually measured: token rates. I did not count a single memory transaction or cache miss. The arithmetic-intensity story is the inference I’m drawing from the shape of the results, not something these benchmarks demonstrate on their own.
The gain depends on how many threads you run
Here is where it gets more interesting than “more channels, more speed.”
Generation improvement by thread count:
| Model | 2 threads | 3 threads | 4 threads |
|---|---|---|---|
| Gemma 3 1B | +17.0% | +38.3% | +52.5% |
| SmolLM3 3B | +18.8% | +47.1% | +58.4% |
| Llama 3.2 3B | +20.2% | +47.5% | +57.5% |
| Gemma 3 4B | +21.9% | +46.4% | +55.4% |
At two threads the second stick buys you about 20%. At four it buys you about 56%. The gain is real at every thread count, so this isn’t a threshold you cross. It scales.
Worth flagging: the two- and three-thread rows ran at -r 2 rather than the -r 3 behind the four-thread headline. Two repetitions is thinner, and I’d treat the exact percentages in those two columns as approximate. The monotonic climb across them — 19.5%, 44.8%, 55.9% on average — is well clear of a run-to-run spread that never exceeded 0.28%.
Run this machine at -t 2 and you throw away roughly two thirds of a RAM upgrade you already paid for.
What’s actually happening
The obvious story is that one channel was the ceiling and I doubled it. The numbers say that story is wrong, or at least badly incomplete.
If a single channel had been the only thing holding generation back at two threads, then doubling the channels at two threads should have roughly doubled generation. It gave 17-22%.
There’s a second clue. On single-channel, going from two threads to four barely helped generation: SmolLM3 moved 3.5%, Llama 3.2 3B moved 4.6%, Gemma 3 4B moved 3.1%. Only the little 1B did better, at 12.9%. Essentially flat.
On dual-channel that same two-to-four jump is worth 31.4% on Gemma 3 4B, 37.1% on Llama 3.2 3B, 38.0% on SmolLM3 and 47.1% on Gemma 3 1B.
So thread count did nothing before the upgrade and does a great deal after it. What changed is not just how much bandwidth exists but whether the cores can ask for it fast enough.
The term for this is memory-level parallelism. A core can only have so many cache misses outstanding at once. Two cores can only keep so many requests in flight. With one channel, two cores were already generating enough requests to keep that channel busy, so adding cores did nothing and the machine looked bandwidth-bound. Doubling the channels doubled how much memory could be delivered, but it did not change how fast two cores can ask. The extra capacity sat there until I added threads to fill it.
Lifting one ceiling exposed a second one that had been hiding underneath.
Same caveat as before, and it matters more here because this passage is doing more work: memory-level parallelism is the best explanation I have for a thread sweep that goes flat on one channel and steep on two, and it is the conventional one. But I inferred it from that sweep. Nothing here counts outstanding misses or measures queue occupancy, so read it as the reading that fits the curve rather than a mechanism I caught in the act.
The trap this sets
Say you own a single-channel mini PC and you benchmark thread counts on it, which is a sensible thing to do. You find that generation is flat from two threads to four. You reasonably conclude that your CPU has nothing more to give and that threads don’t matter for token generation.
You’d be wrong, and you would have no way to know it from that machine. That flatness was a property of your memory configuration, not your processor. Put a second stick in and thread count suddenly matters a great deal. Any thread-scaling conclusion drawn on a single-channel box only describes that box in that configuration.
The part that doesn’t add up
Doubling the channels did not double generation, and I can’t fully account for the gap.
Take SmolLM3 3B. Single-channel at four threads is 7.72 tok/s. Twice that is 15.44. Dual-channel at four threads measured 12.22. That’s 58% of the way, not 100%.
Two explanations fit, and I have not separated them:
The work may not be purely bandwidth-bound. There is real arithmetic in generation, and if some fraction of the time is spent computing rather than waiting on memory, doubling bandwidth can’t double the result.
Or four threads still can’t saturate two channels. Same memory-level parallelism argument as above, just one level further out. If two cores couldn’t fill one channel’s worth of headroom, four cores may not fill two.
Both are plausible. Telling them apart needs a machine with more cores on the same memory setup, which I don’t have sitting here. So I’m not going to turn this into “buy a CPU with more cores.” Nothing I measured supports that.
Check your own box
Worth two minutes even if you do nothing about it.
On Linux:
sudo dmidecode -t memory | grep -E "Size|Locator|Rank|Configured"
You want to see two populated slots with different channel locators. One populated slot and one No Module Installed means you’re running single-channel.
On Windows, Task Manager’s Memory tab reports “Slots used: 1 of 2” and that’s enough to tell.
Then check what it costs. A new Crucial 8GB DDR4-2400 SODIMM runs about $58 at Newegg as I write this. I paid $36 for mine, a used office pull. That’s what I paid rather than a going rate, and secondhand stock being what it is you may do better or worse on the day. For a machine that was itself an office castoff, the used route is the sensible one either way.
Two things I’d tell you before you buy:
Match the capacity, not the part number. My two sticks are different brands and even different ranks: a single-rank PNY and a dual-rank Crucial. Both 8GB, both DDR4-2400, and the board interleaves them fine because the capacities match. Mismatched capacity is where you drift into partial dual-channel territory.
Watch the part number letter. I ordered a Crucial CT8G4SFS824A and what arrived reports as CT8G4SFD824AC16FBD1. SFS is single-rank, SFD is dual-rank. Different SKUs, and if you care which one you’re getting, that one letter is the whole difference.
What this doesn’t tell you
One machine. Four small dense models. DDR4-2133. That’s the whole sample.
The mechanism generalizes. Token generation streams the model’s weights for every token with essentially no reuse, so it tracks memory bandwidth on any CPU. The size of the effect is a different question, and I wouldn’t promise you 56% on hardware I haven’t touched.
Mixture-of-experts models are the obvious asterisk. They only activate a fraction of their weights per token, so they move far less memory, and the curve is probably shaped differently. I haven’t measured it.
I have three more machines of the same class queued for the same upgrade. Those will say whether 56% is a property of this configuration or a lucky number on one box.
They aren’t clones, though, and that’s worth knowing before the follow-up lands. boa already reports a different BIOS slot-locator scheme than the other two, which means the firmware underneath isn’t identical even across machines I’d describe as the same class. Same-class is not same-box, and if the next three come back with a spread rather than four copies of 56%, that is a candidate reason.
What I’d do
If you run CPU inference on a two-slot machine with one stick in it, fill the slot. Five minutes with the bottom cover off. On a used mini PC it’s the cheapest real speedup I know of, and cheaper than cycling through models hoping one of them turns out to be secretly fast.
Then set your thread count to your physical core count and check that it actually stuck. Otherwise you’ve bought the bandwidth and left it sitting in the slot.
Benchmarks run with llama-bench from llama.cpp build b10326, CPU backend, four Q4_K_M models. Three repetitions per figure at four threads; the two- and three-thread sweep ran at two. Raw output for both the single-channel and dual-channel runs is archived alongside the write-ups.
A weekly email with every new guide and measured benchmark.
Subscribe — free, no spam